What happened?
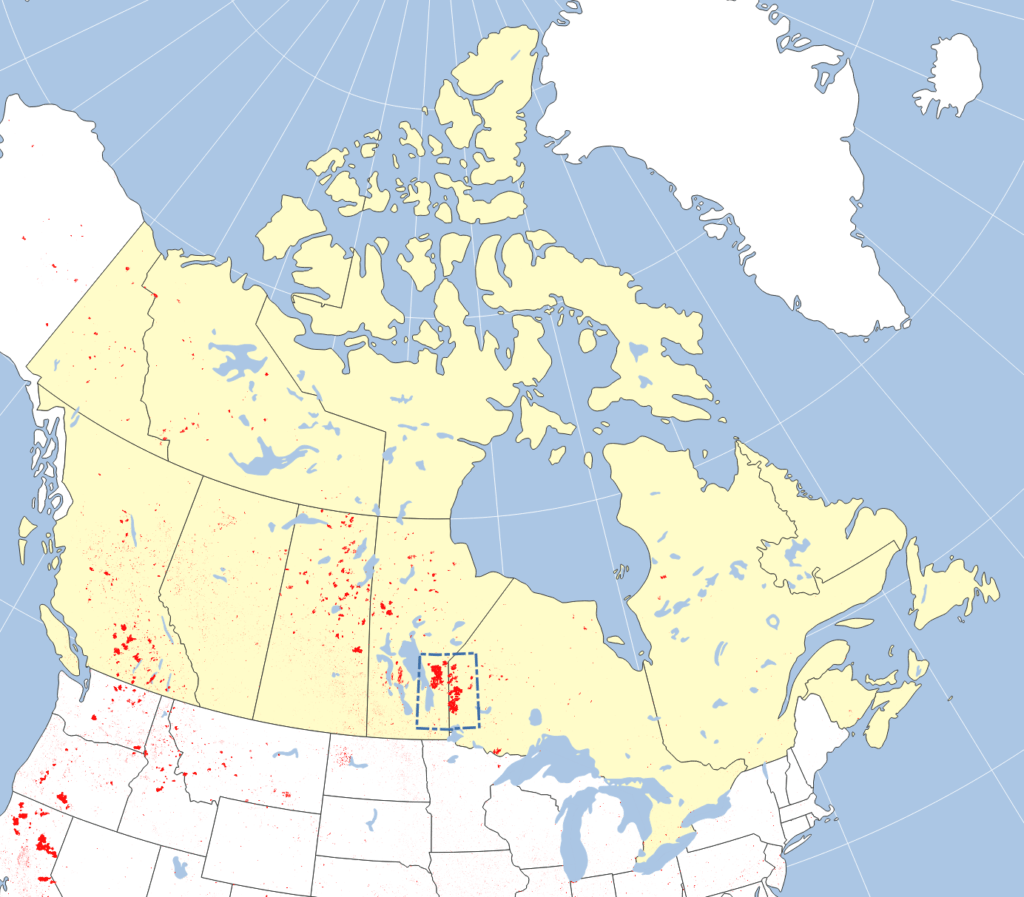
Over the summer of 2021, over one million hectares of forest burned down east of Lake Winnipeg (Ojibwe: ᐑᓂᐸᑲᒥᐠᓴᑯ˙ᑯᐣ) in Canada. The affected area straddling the Manitoba-Ontario border is mostly inhabited by First Nations. Over 8 000 residents from nine First Nations had to evacuate to be safe from the fires. Most residents had to stay away from home (typically in the city of Winnipeg) for about three weeks. However, the First Nations of Little Grand Rapids and Pauingassi were unable to return to their homes for over eleven weeks. This was because wildfires destroyed the power lines supplying their homes and it took that long to repair them. Evacuees had reported that they had a very hard time coping with city life and Covid-19 restrictions (GlobalNews).
We created a wildfire map of the affected area. You can find the interactive map at the bottom of this news release.
Our BlazeMap™
At the end of this article you’ll find an interactive version of our BlazeMap™ created with the latest machine learning technology. To create the burned area polygons, we ran the machine learning system we had used for our study area in Siberia on more than 1 000 satellite images.
Check out the interactive map at the bottom! You can click on each burned area cluster and it will show you the start and end dates of the fire as well as the total area. Furthermore, the individual First Nations inside our study area are shown with black and red markers. Red markers indicate First Nations that evacuated partly or fully. If you click on one, you’ll see the approximate evacuation dates, number of people evacuated, and a link to a pertinent news story.
The total size of the study area is 13 452 000 hectares. Of these, the wildfires burned 1 012 000 hectares according to our machine learning system. That’s 7.5% of the total.
Do you need the map on the bottom for your own geospatial analysis? We can send you the file free of charge. Just send us an e-mail and tell us a little bit about your use case. We’ll send you the map in your preferred format.
How good is this map?
As always, our map is accurate to 40 meters. The images below show how closely our BlazeMap™ tracks the actual burned area. Our wildfire map even reflects tiny patches of burned area and small unburned islands. You can also see that our machine learning system has no problem with clouds or cloud shadows. This is because it considers satellite images from multiple times.
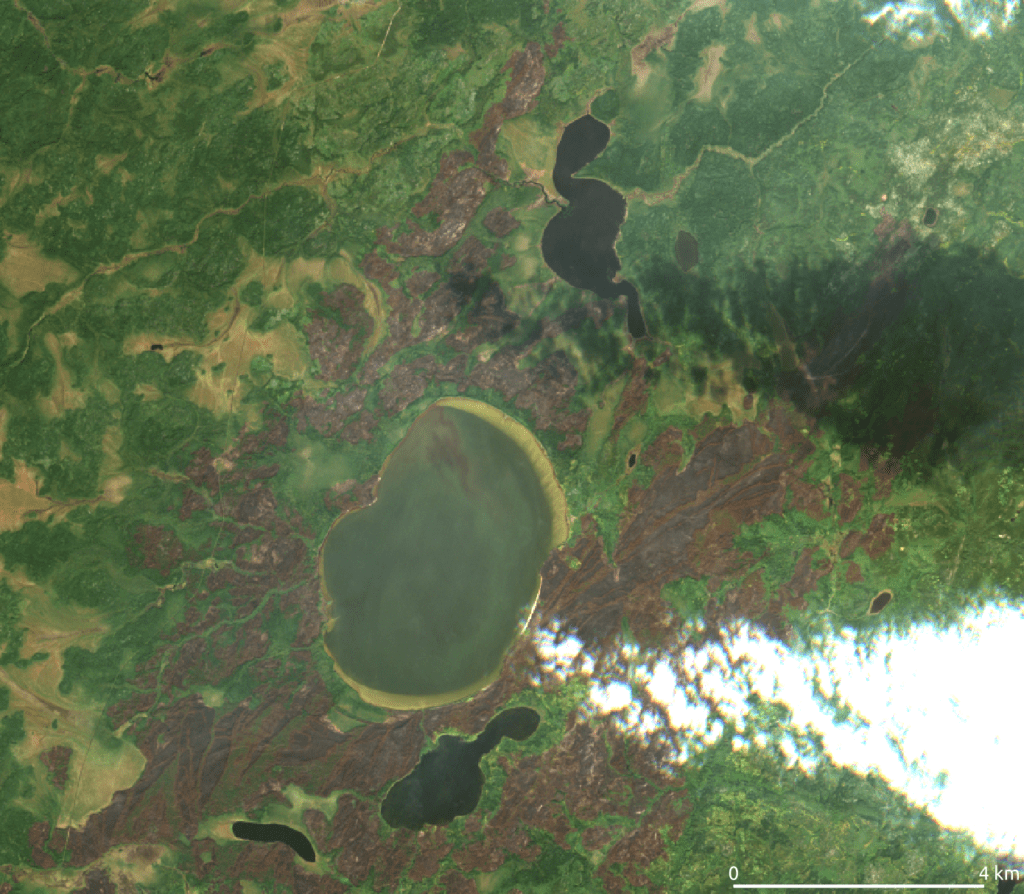
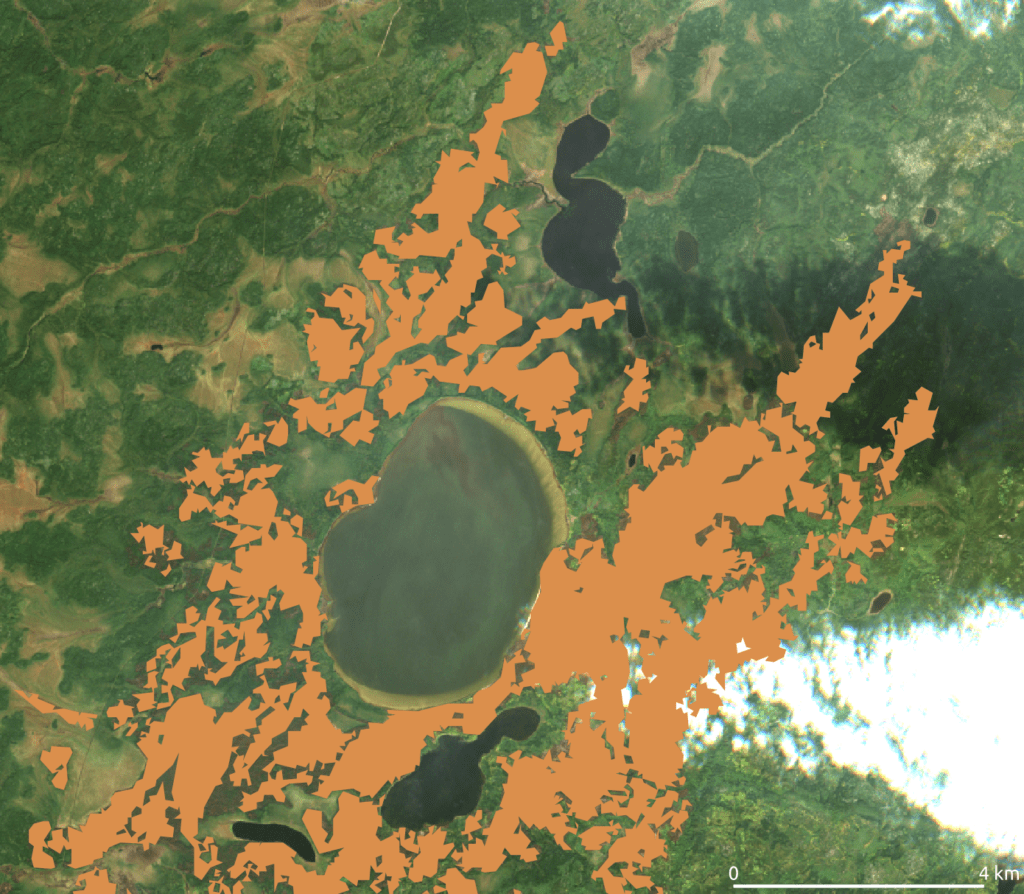
The overall accuracy of the map is 98%. We achieved a precision of approximately 85% and a recall (detection rate) around 95%. That means out of 20 validation plots inside our burned area result, the wildfire had scorched 17 in reality. Conversely, of 20 plots burned on the ground, 19 would be detected. We can significantly improve these scores if we tailor our system to a study area’s local conditions.
Our BlazeMap™ machine learning system is the most accurate burned area mapping system on the market. The 40-meter spatial resolution of our wildfire map beats all other burned area map providers by an order of magnitude. In addition, we are happy to guarantee accuracies exceeding 90% (for both precision and recall) to our paying customers. In ideal circumstances, we can deliver the BlazeMap™ as soon as 48 hours after you place an order. This is possible due to our machine learning system’s high level of automation.
How can wildfire maps help you?
Our 40-meter BlazeMap™ is the perfect data source for any use case that requires a detailed and accurate burned area map.
Let’s entertain a counterfactual: Imagine you’re working for Manitoba Hydro in the summer of 2021. Your power lines stopped delivering electricity, like they did. Imagine you had access to our wildfire map. You could have quickly identified potential damage to the power lines and how access to them might be compromised. This way you could have sped up the repair campaign. Then, the Little Grand Rapids and Pauingassi First Nations could have returned to their homes sooner.
Another use case: BlazeMap™ can be integrated into public wildfire information systems like Canada’s CWIFS, NASA’s FIRMS or Europe’s EFFIS. Or would you like to estimate CO2 emissions from our area-true wildfire maps? We can make that happen. Do you need accurate burned area maps for your wildfire research? We’ve got you covered. These are just a few of the use cases we can think of.
Note that due to the high level of automation, we can provide our mapping services relatively cheap. For instance, for the analysis presented here we would have charged EUR 6 400 (CAD 8 800, USD 7 100). However, you can rest assured that our wildfire experts vet the result.
Could you benefit from better wildfire maps? Then feel free to shoot us an e-mail with your use case. We’ll get back to you with our offer. Do you need more information in addition to your BlazeMap™ wildfire map? We’re happy to provide any additional geospatial or forestry analysis that you need for your project.
Interactive wildfire map
Here’s the interactive map!