According to the Copernicus Atmosphere Monitoring Service, fire activity in the first months of 2022 in South America has been the most intense since the beginning of the study, in 2003. What is the meaning of this? Sadly, the meaning of this is that we can expect wildfires that will be both more intense and more frequent. So, one starting point to understand the consequences of wildfires and make better decisions to reduce their negative impact is to have a better way to efficiently map and monitor them.
In the beginning of 2022, a massive number of fire outbreaks** took place in the North-eastern region of Argentina. This region includes the province of Corrientes and the Iberá National Park, one of the most important wildlife sanctuaries in America.
The catastrophe in Corrientes was not only aggravated by last year’s strong heatwaves and their corresponding droughts, but also due to people actively engaging in starting fires in the region**. This set of conditions makes it very difficult for local authorities to respond efficiently to stop the wildfires from spreading and growing.
This document uses the automated pipeline designed at EDEO to provide an estimation of the amount of hectares lost to wildfires in a study region around Corrientes. The study comprises the period of December 2021 to the 14th of February 2022. In the future, we could get a better idea of the intensity of the catastrophe comparing the obtained values to the amount of hectares lost to wildfires one or two years before on the same region.
**source in spanish
A bird’s eye view of the problem with the EDEO Pipeline
The EDEO pipeline allows to efficiently gather data to build a fire monitoring system on demand on a wide range of scales. First, I specified the study region and dates of focus for the analysis. Then, I ran the pipeline to get all the information needed to develop a machine learning model to classify burned areas.
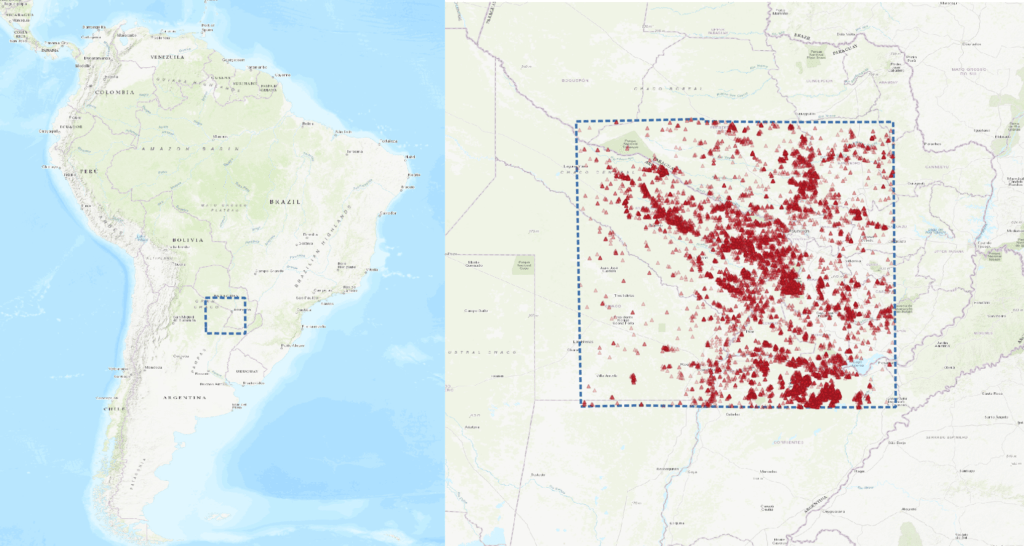
The area I decided to study includes several populations that were affected by the ongoing fires. It comprises the border between Argentina and Paraguay and it made it to the main pages of several local newspapers due to the catastrophic fires that raged within this months. Recently, the fires were reported to finally be under control on the first of March** of this year.
Some of the images I encountered during my analysis really perturbed me after seeing the intensity and extent of the fires. This was even worse when I stumbled upon pictures where the fires could be seen raging, like the image below, from the 31st of January of 2022.


**source in Spanish
A map is worth a thousand images: the EDEO BlazeMap™
The last step of the EDEO pipeline is to generate all the inputs needed to create what we called the BlazeMap™. It was introduced in this news post. This map shows the start and ending dates, as well as the number of hectares lost to a given wildfire. You can explore for yourself the alarming estimate of 1.5 million hectares lost to wildfires from 1st of December 2021 to 14th February 2022. This amounts to almost 6% of the study area.